

Case study · Software development
From the solar arrayto the neighbour's meter
Helioneo shares solar electricity between producers and consumers on the same territory. We designed the platform that makes this energy understandable — from metering data through to billing.
How collective self-consumption works
- Householdresident
- Shopbusiness
- Councilpublic building
Electricity produced on one roof is shared between participants within the same perimeter. The whole difficulty is making that sharing readable for each of them.
- Client
- Helioneo — Silversun Group
- Sector
- Solar and collective self-consumption
- Our role
- Platform, integrations and client area
- What followed
- An ecosystem of internal tools
01 — The starting point
Data that is perfectly accurate, and perfectly unreadable
Metering data is accurate to the half-hour. It is also, for anyone outside the industry, a column of meaningless numbers. A participant does not want to study a load curve: they want to know whether the sharing works in their favour, and by how much.
| Timestamp | kWh |
|---|---|
| 08:00 | 0.412 |
| 08:30 | 0.478 |
| 09:00 | 0.655 |
| 09:30 | 0.741 |
| 10:00 | 0.802 |
| 10:30 | 0.869 |
Last month, a large share of your electricity came from the roof next door.
The same data, turned back towards its use.
02 — The platform
A space where energy reads at a glance
The participant area brings together what matters: what was produced, what was consumed, how much was genuinely self-consumed, and how it moved from one month to the next. The interface is built for someone with no technical knowledge of the energy sector — that was the main constraint.
A typical day
- Solar production
- Consumption
- 00h
- 06h
- 12h
- 18h
- 23h
Self-consumption rate
share of consumption covered by local production
- Production and consumptionBoth curves overlaid, hour by hour, day after day.
- Self-consumption rateThe share genuinely covered by local production, not an estimate.
- Monthly historyEach month set against the previous one, so you see a trend rather than a snapshot.
Interface representation. The curves and the rate illustrate a typical day; they are not a real participant's readings.
Interactive map hosted by Helioneo
Displaying it loads third-party resources (tiles, fonts, scripts) and sets cookies on Helioneo's domain. Nothing loads until you ask for it.
The product
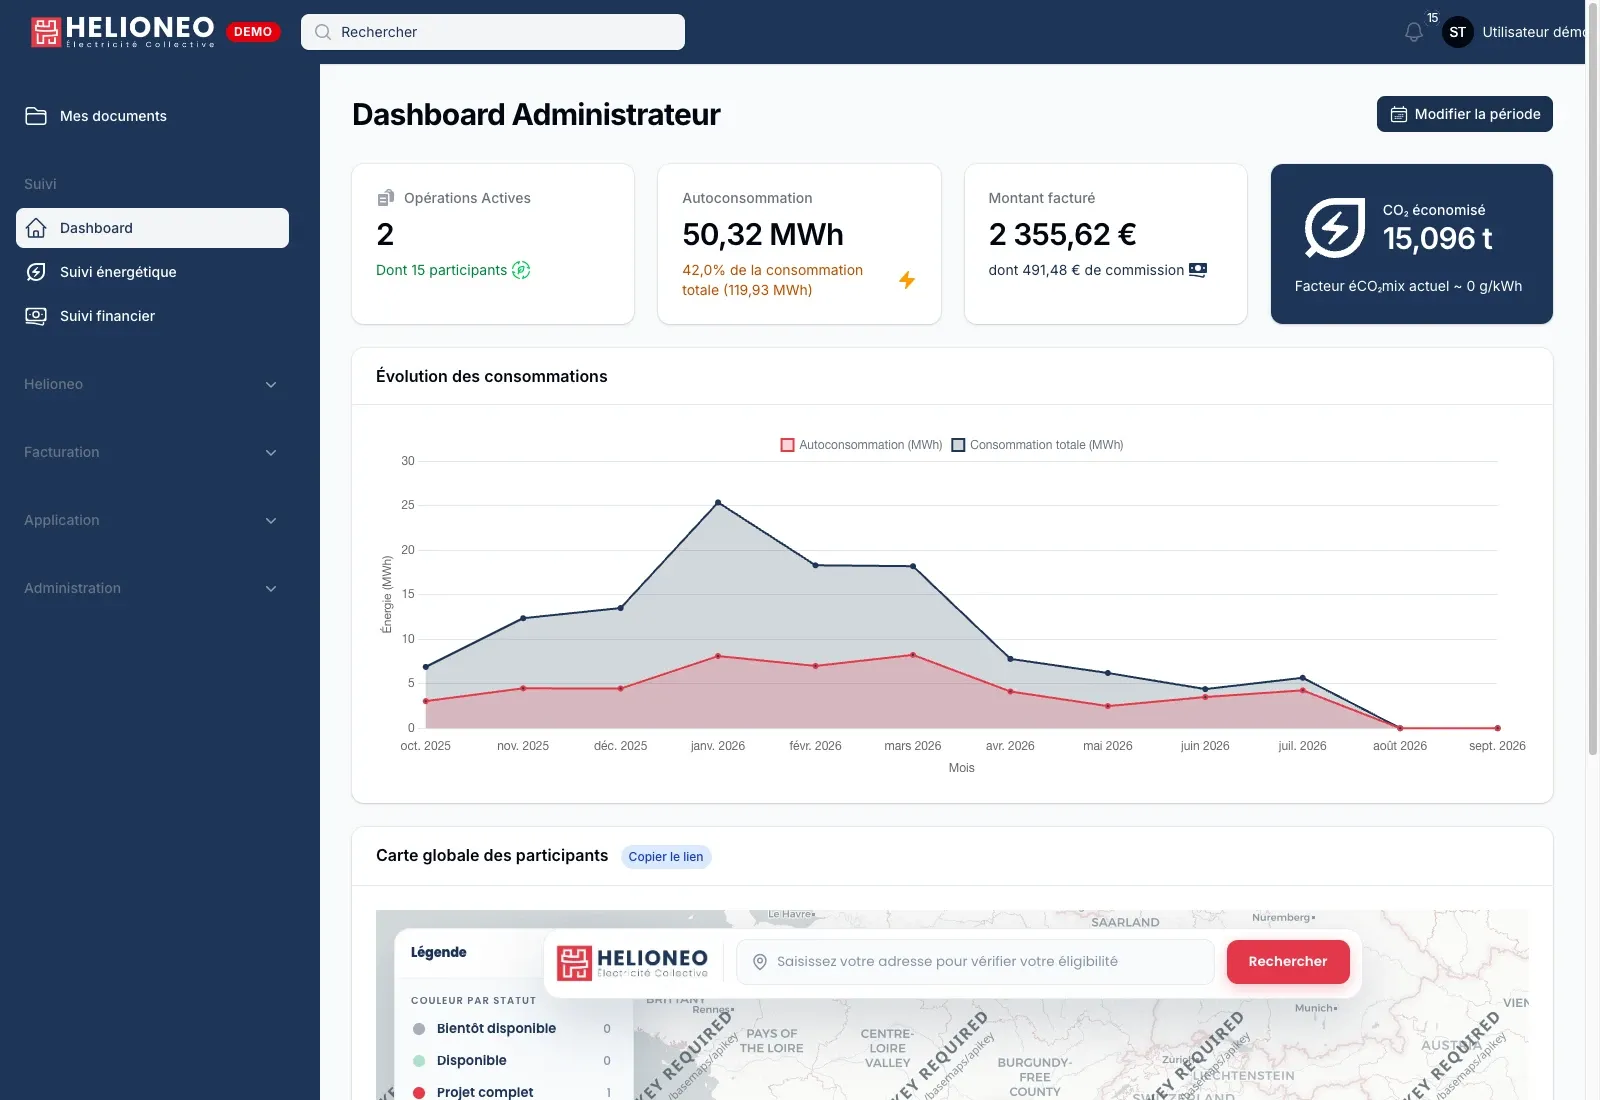 The dashboard: operations, self-consumption, billing and CO₂ avoided
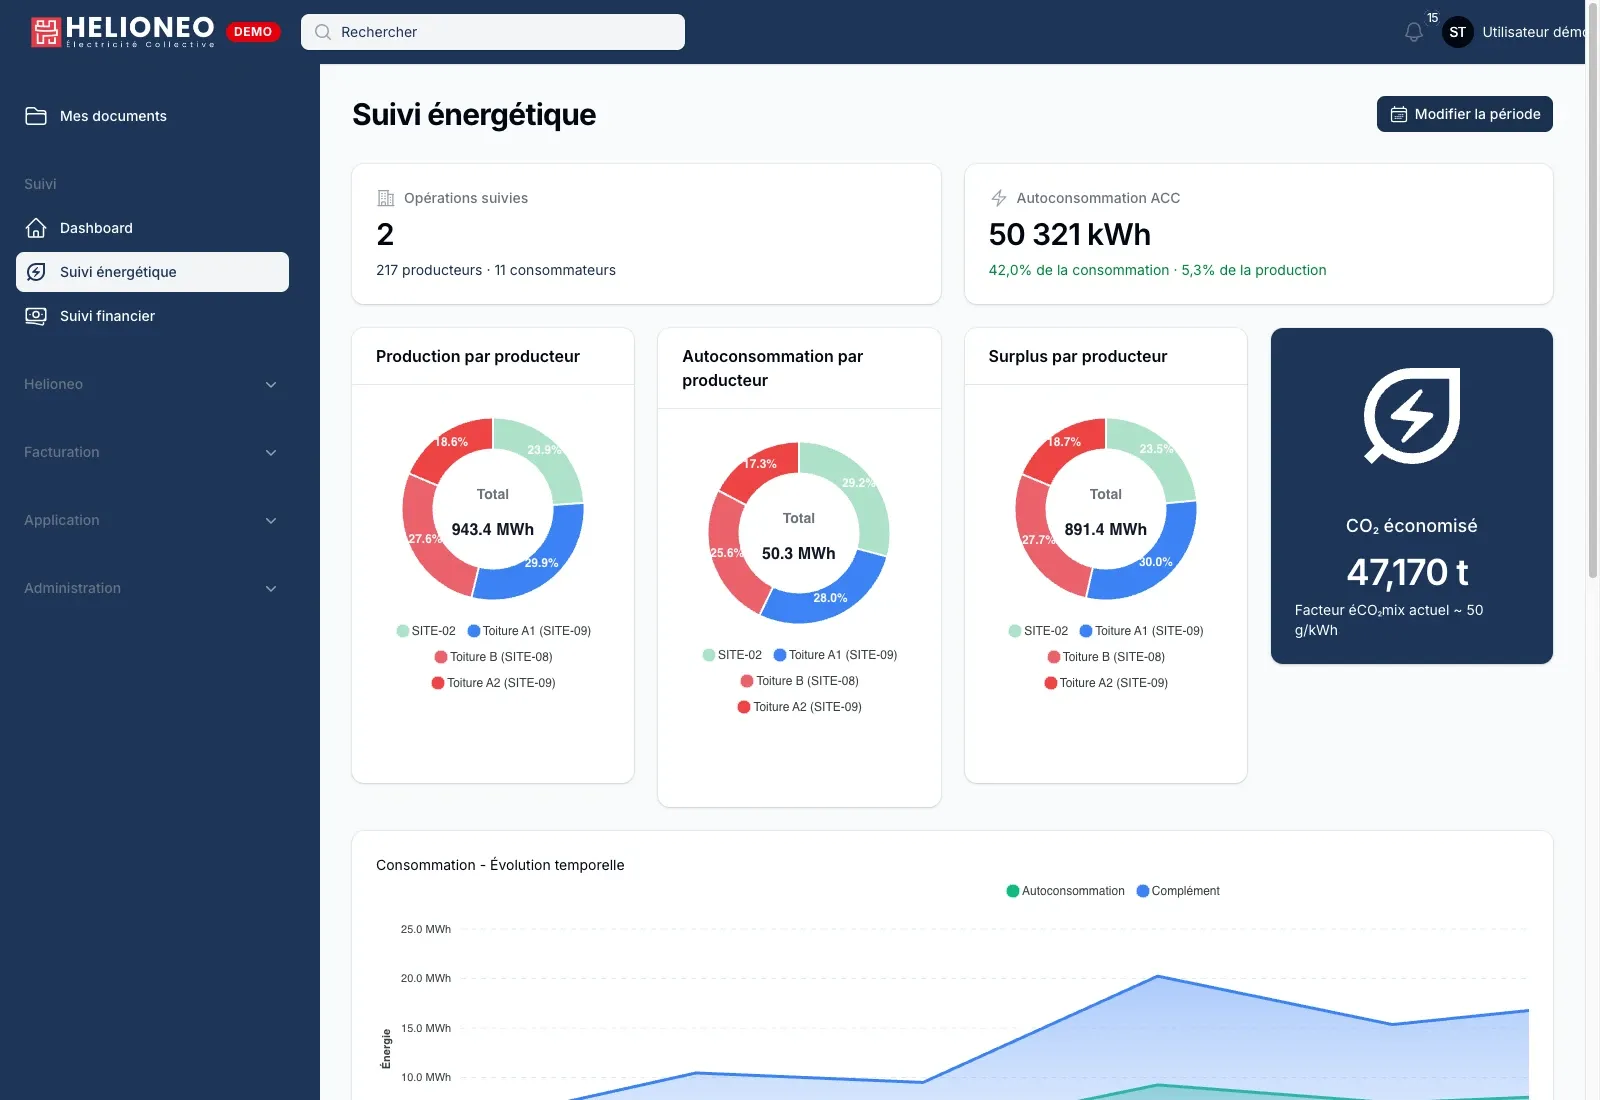 Energy tracking, producer by producer
Real screenshots of the demonstration instance. Installation and site names have been replaced with neutral labels.
03 — What had to be wired in
Behind the simplicity, two technical chains
A simple interface says nothing about what it assumes. Here, two chains carry the promise: the one that fetches metering data, and the one that takes payment. Neither tolerates approximation.
EnedisMetering data
- Participant consent
- Calls to the data interfaces
- Scheduled synchronisation
- Processing and account matching
StripePayments and subscriptions
- Sign-up journey
- Subscriptions and billing cycles
- Transaction tracking
- Reconciliation with the client account
Shared foundation
- Accounts and roles
- Secured exchanges
- Audit logging
- Data history
04 — What came next
What one successful product sets off
The collaboration did not stop at the platform. A line-of-business product that keeps its promises builds the trust needed to take on the rest of the information system — and that is how the scope widened, one brick at a time.
- The platform
The participant area and energy tracking, first product of the collaboration.
- Prospecting
The tool driving business development, grafted onto the same data.
- Identity (OIDC)
One account across every product in the group: the brick that holds the rest together.
- The toolbox
Common building blocks pooled across projects, to stop rewriting the same thing.
- The CRM
Sales relationships tooled around the group's real practice, rather than the reverse.
- Internal tools
The remaining business tooling, sitting on that same foundation.
In short
A technology partner, not a supplier
What began as an energy tracking platform became a set of tools that shape the group's daily work. The difference lies not in the number of projects, but in the fact that each one builds on the last.
A similar project?
Tell us about your situation. The first conversation is free and without obligation, on site in Nice and the surrounding area.